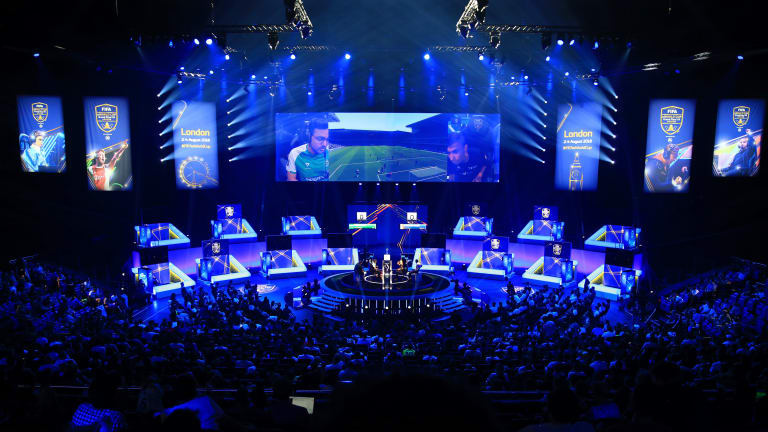
Esports describes situations where digital (video) games are played competitively. It is a rapidly growing subsection of the games industry and associated culture, which has evolved from a niche segment into a mainstream global phenomenon. In 2017, over 388 million people worldwide played or watched esports, and the number of esports fans is projected to grow a further 50% by 2020. Not only is esports globally popular, but also supports a rapidly growing viewership. Esports take different shapes, from digital versions of traditional sports such as soccer, basketball and football, to first person shooters such as Counter Strike: Global Offensive or games set in fantastic and magical worlds such Dota 2 and League of Legends. Broadcast coverage of esports follows the same approaches as traditional sports broadcasting, with e.g. pregame coverage featuring expert panels, athlete coverage, and post-match commentary, interviews etc.
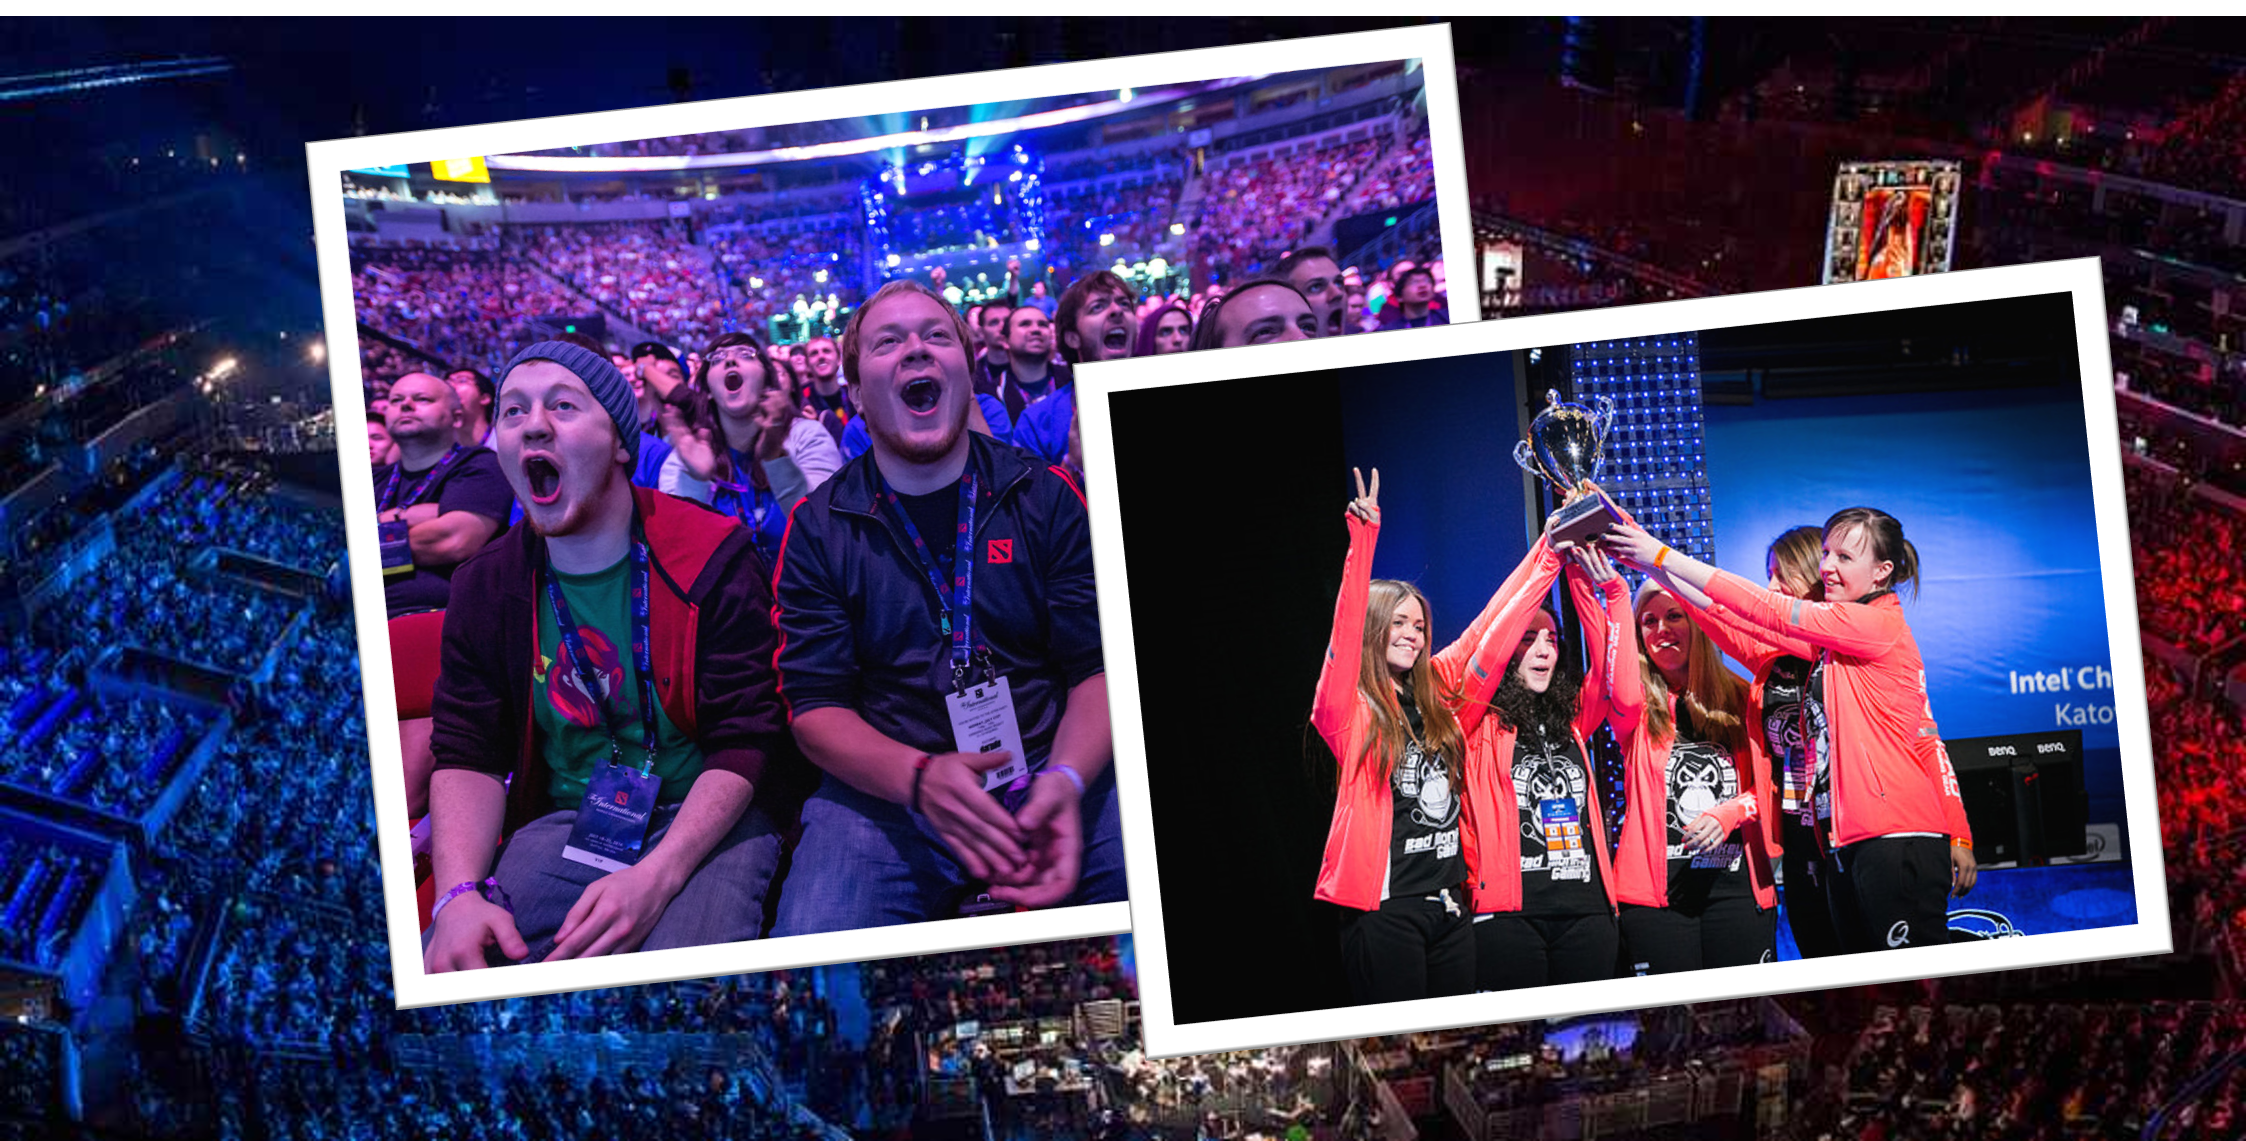
Spectating esports is an increasingly common pastime and important part of mainstream entertainment. Two of the biggest esports titles, Dota2, and League of Legends attract millions of viewers, and their world championships boast multi-million dollar prize pools. Both are Multi-Player Online Battle Arena (MOBA) games, seeing two teams of five players, each controlling a fictional character, battling in a virtual arena. The goal of both games is to destroy the opponents’ base.
With more viewers, and more revenue on the line, comes a desire for something which is commonplace in traditional sports: accurate analytics. Given the digital nature of esports games, all actions of players can be tracked and analysed, providing unprecedented volume and precision in performance tracking as compared to traditional sports. Esports data and the analyses and statistics that can be derived from them, can be used both by broadcasters, viewers, analysts, teams and players of the game.
The esports industry has expanded in global size at a considerable pace in the past few years. The open availability of detailed behavioural telemetry from many esports titles has fuelled an emergence of start-ups that are building services on top of the data, or exploring new ways of monetising tournaments and audience. Collectively, the esports industry is producing knowledge at an increasing pace, however, due to commercial confidentiality this knowledge is not publicly available and building a reasonable state-of-the-art in esports is therefore challenging at best..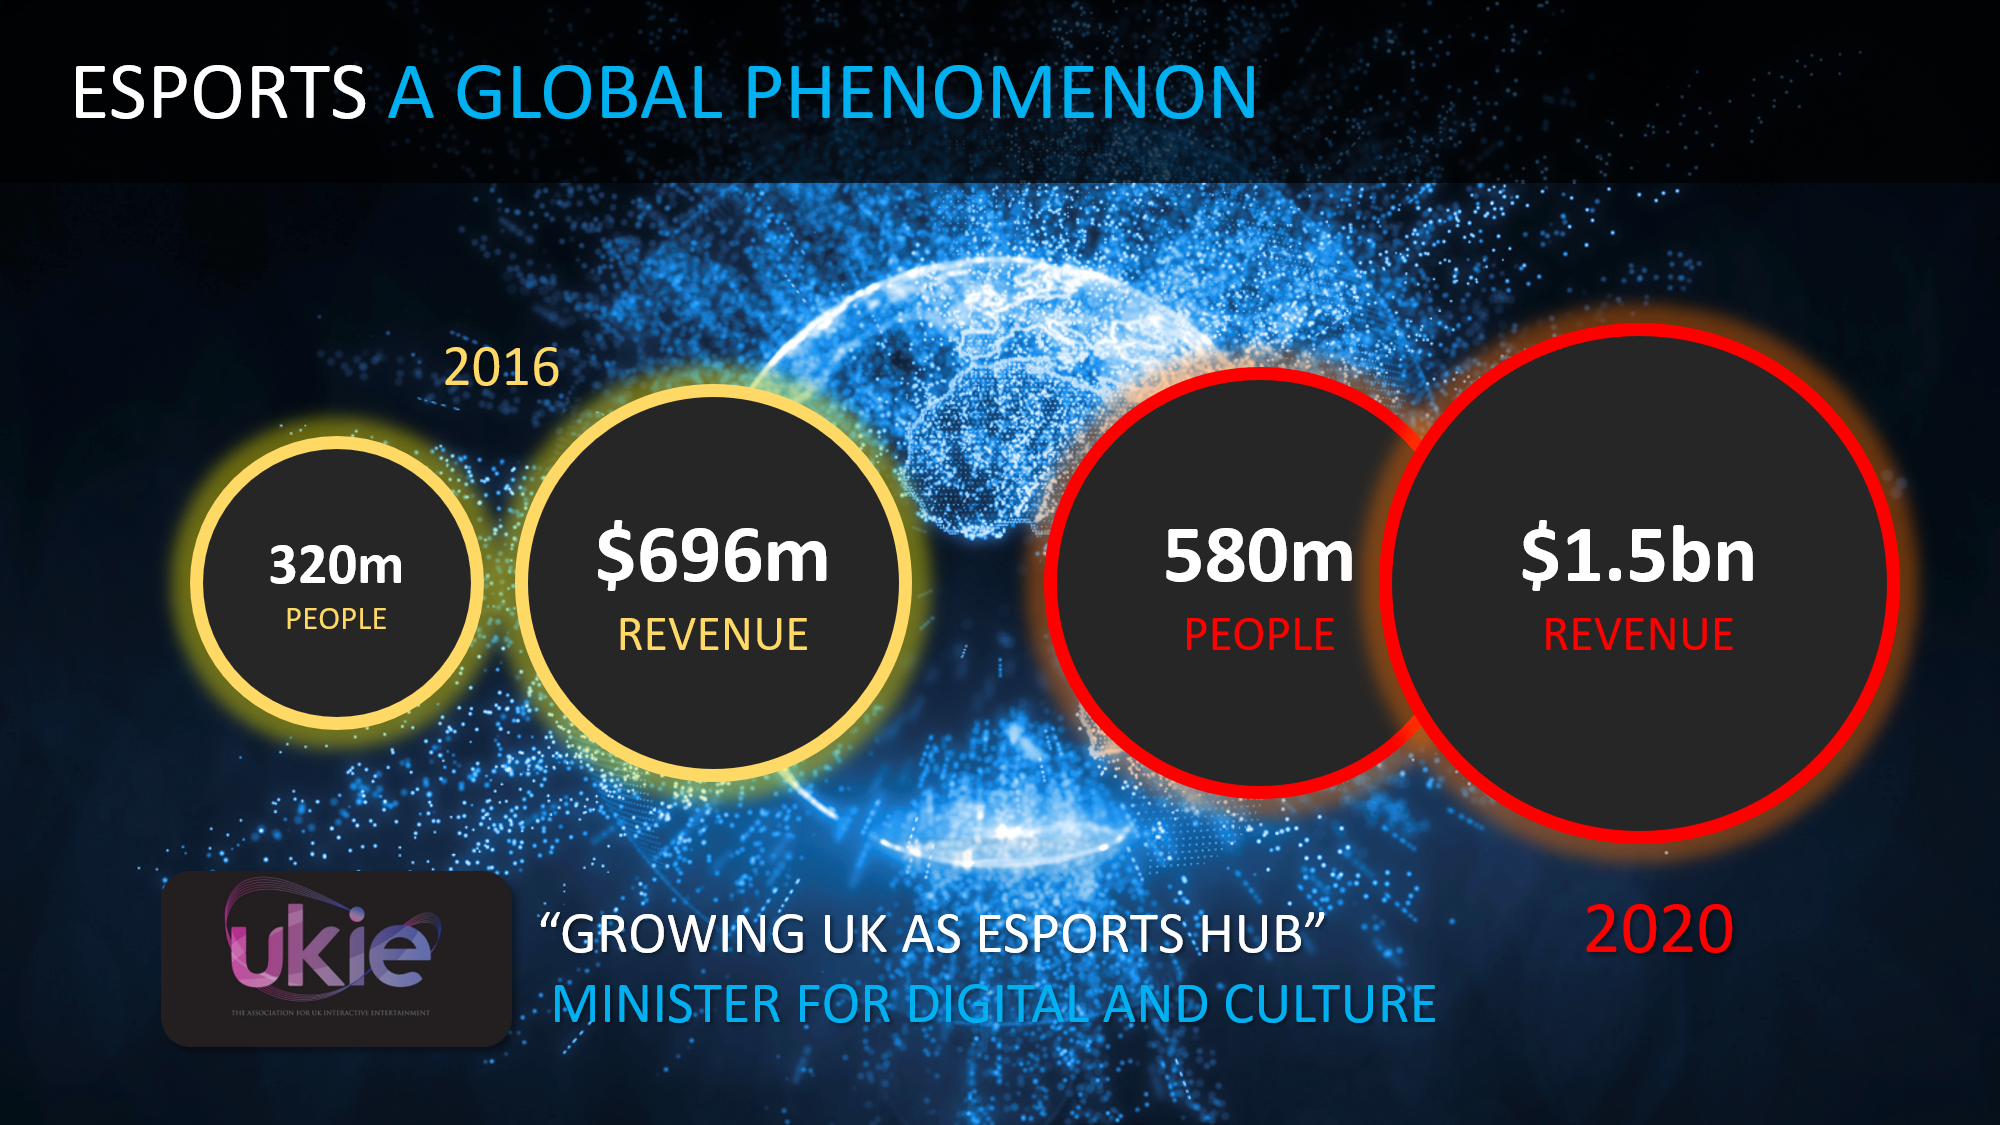
On the academic side, there has been a steady stream of papers with the term “esport” in the title being published over the past one to two decades. Not all of these use the term in the same way, and there is as yet no common definition of what constitutes esports, but the term generally refers to digital games being played in a competitive manner, whether at the amateur level, professional level or both. Academic work on esports is published across a wide variety of disciplines, including AI, analytics, psychology, education, visualisation, ethnography, marketing, management, business and regulation. However, academic research is at risk of being made rapidly obsolete on an ongoing basis due to the constant evolution of the games (e.g. as datasets are made obsolete due to game updates), the communities and the business models in use. Furthermore, as different academic domains explore esports, a substantial amount of repetition is evidenced in publications as they investigate esports without awareness of the work across academia.
There is no commonly accepted definition of esports analytics, but research and industrial applications in the area generally operate within the area of business intelligence work centred on esports. This means that the analysis of behavioural telemetry, sales data, production etc., while occurring across a number of disciplines, use the same term to describe the area of work. Following this viewpoint, proposed esports analytics as the following: “the process of using esports related data, […], to find meaningful patterns and trends in said data, and the communication of these patterns using visualisation techniques to assist with decision-making processes”. This definition highlights that the fundamental challenge in esports analytics is to make the vast amounts of data available useful to the stakeholders, whether game companies, audience, tournament organisers, broadcasters, commentators or service companies. The definition puts esports analytics at a fluid boundary with game AI for esports, which has a strong tradition in its own right, e.g. the training of AI opponents or bots in esports games such as StarCraft.
Case Study: ECHO – Harnessing esports data for live tournaments
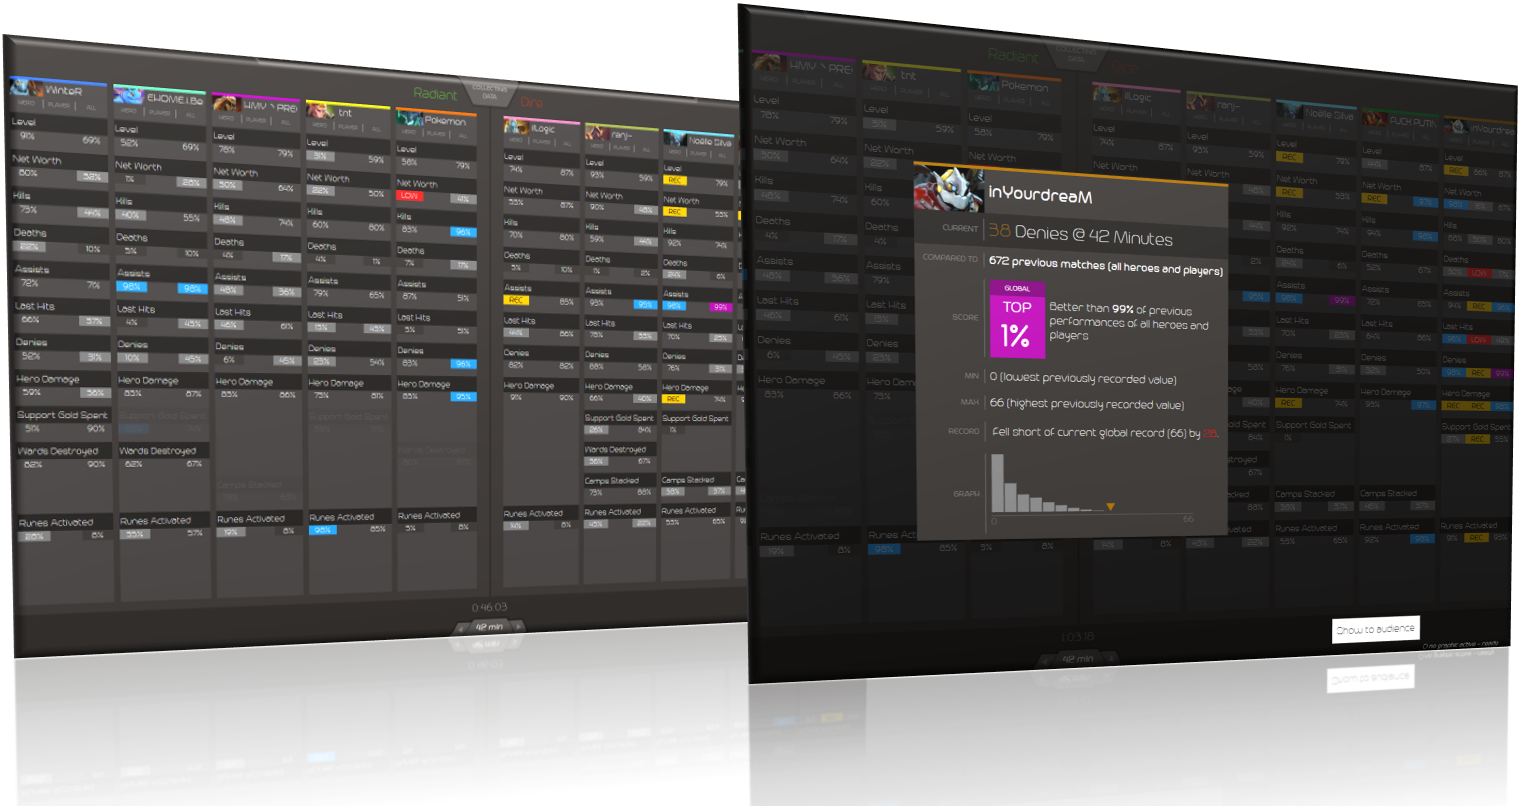
To improve the audience’s ability to track hero performance, we developed a new tool called Echo. Echo is an example of how data can be harnessed to add value to the esports ecosystem. Echo is a production tool for esports which uses large volumes of historic match data to detect highlights in live matches of the game Dota 2 and provides mechanisms for automatically translating these highlights into audience-facing graphics. It was implemented at one of the largest international esports tournaments – ESL One Hamburg 2017, watched by 25 million people online – which allowed the gathering of a wealth of experimental data. The production tool forms the basis for multiple research collaborations, discussions with industry and collaboration with the largest esports tournament organizer worldwide, ESL. ORACLE: Oracle is a stand-alone tool for predicting match outcomes in live as well as recorded esports matches. Oracle is based on building random forest models via historical professional- and mixed-rank esports match data. It is integrated into the ECHO suite of tools. ORACLE was implemented at one of the largest international esports tournaments – ESL One Hamburg 2017, watched by 25 million people online – where it tested out at 85% accuracy within 5 minutes of gameplay. The output from the ORACLE model serves to provide commentators and viewers with information and insights.
Echo displays one column per player, five per team. Within each column, Echo shows a list of 12 KPIs that capture various aspects of the player’s performance, significantly expanding Dota 2’s out-of-the-box statistics. The KPIs were chosen as a result of technical availability (what we could access in the live data stream) and our expert’s advice for covering a range of different playstyles and roles. Echo calculates the percentiles of the live performances – or how many percent of historic performances are exceeded in the live game. For each KPI and player, Echo provides three values: 1) The first percentile expresses how the player’s performance at the current minute relates to thousands of previous performances of the same hero. 2) The second percentage shows how the player’s live performance compares to the player’s personal match history. This column is suitable to detect if a player has a particularly good or bad game compared to their historic performance. 3) The third column shows how the current performance is situated within all matches within the reference data, including performances by any player and any hero. This column is particularly suited to track “all time” records or extraordinary performances across heroes. Values that exceed any value in the scope are marked with “REC” = record. Negative records (worst values ever observed in each respective scope) are marked as “LOW”. Values that exceed certain thresholds are colour coded (yellow = record, purple = top 1%, blue = top 5%, red = negative record). The colour coding assists the operator with identifying interesting constellations. For instance, in the row Networth highlighted by the magnified portion of Figure 2 one can deduce that for the hero, the player lies within the top 2% of historic performances, but does relatively poorly (bottom 16%) compared to their personal match history. This indicates that this player usually picks heroes that are capable of obtaining gold faster. The third column tells us that in the global reference frame, taking into account all heroes and players, the player performs only above average. Clicking any percentile opens a more detailed information dialog, giving the operator additional information for the specific performance, including a histogram, current minimum and maximum records and a preview of the type of core messaging that would be shown to the audience (see Figure 3, left). Pressing the button in the top right corner of the preview will automatically generate an audience-facing graphic, which can then be superimposed over the in-game footage.


The main goal of the design of the graphics was to reduce complexity and to provide a single, clear message to the audience. As stories revolve around players, a natural part of the visual design would be a portrait, and the player’s gamer tag (the in-game nickname). The more difficult task was to wrap the core message into a clear presentation. As it is well established, special care needs to be taken when conveying statistics to the public, as statistics literacy may widely differ and even basic statistical concepts, such as percentiles, may not be well understood [51]. Consequently, we presented the percentile with a qualitative cue “Top X%” or “Bottom X%”, including an adjusted percentage that creates a correct representation of the percentile. For instance, Echo can identify the player’s performance as being in the 97th percentile, translating into the phrase “Top 3%”. While we did not expect most viewers to read information beyond the core messaging, we did want to provide a second level of information that commentators and quick readers could access, essentially describing the scope of the performance. The percentiles depend on the current minute in the game as well if one compares current performance to all games of a certain hero, the player’s match history, or all games in the database. To visually break up this information, we added two sets of information to the graphics. Above the core message, we displayed the current value of the KPI (e.g. “X gold”) and the time the graphics referred to (“@ minute X”). Below the graphics, we added small print that described the scope (hero, player, or all games) as well as the range of games that are considered in our database.
Echo was deployed at ESL One Hamburg 2017 and ESL One Birmingham 2019, both among the largest Dota 2 tournaments of the yearly calendar, featuring $1m and $300,000 prize pools respectively, and attracting 25 million online viewers as well as 20,000 fans onsite
Echo provides substantial evidence for the importance of data-driven content production in esports. Our audience survey shows that data and statistics are central to the viewing experience, and audiences have a clear appetite for more data-driven content, such as is presented by Echo.
See also the below case studies on esports analytics
Exploring the relationship between video game expertise and Fluid Intelligence

Hundreds of millions of people play intellectually-demanding video games every day. What does individual performance on these games tell us about cognition? Here, we describe two studies that examine the potential link between intelligence and performance in one of the most popular video games genres in the world (Multiplayer Online Battle Arenas: MOBAs). In the first study, we show that performance in the popular MOBA League of Legends’ correlates with fluid intelligence as measured under controlled laboratory conditions. In the second study, we also show that the age profile of performance in the two most widely-played MOBAs (League of Legends and DOTA II) matches that of raw fluid intelligence. We discuss and extend previous videogame literature on intelligence and videogames and suggest that commercial video games can be useful as ‘proxy’ tests of cognitive performance at a global population level.
Time to Die: Death Prediction in Dota 2 using Deep Learning

Esports have become major international sports with hundreds of millions of spectators. Esports games generate massive amounts of telemetry data. Using these to predict the outcome of esports matches has received considerable attention, but micro-predictions, which seek to predict events inside a match, is as yet unknown territory. Micro-predictions are however of perennial interest across esports commentators and audience, because they provide the ability to observe events that might otherwise be missed: esports games are highly complex with fast-moving action where the balance of a game can change in the span of seconds, and where events can happen in multiple areas of the playing field at the same time. Such events can happen rapidly, and it is easy for commentators and viewers alike to miss an event and only observe the following impact of events. In Dota 2, a player hero being killed by the opposing team is a key event of interest to commentators and audience. We present a deep learning network with shared weights which provides accurate death predictions within a five-second window. The network is trained on a vast selection of Dota 2 gameplay features and professional/semi-professional level match dataset. Even though death events are rare within a game (1\% of the data), the model achieves 0.377 precision with 0.725 recall on test data when prompted to predict which of \textit{any} of the 10 players of either team will die within 5 seconds. An example of the system applied to a Dota 2 match is presented here. This model enables real-time micro-predictions of kills in Dota 2, one of the most played esports titles in the world, giving commentators and viewers time to move their attention to these key events.
Esports Analytics Through Encounter Detection
 Esports is computer games played in a competitive environment, and analytics in this domain is focused on player and team behavior. Multiplayer Online Battle Arena (MOBA) games are among the most played digital games in the world. In these games, teams of players fight against each other in enclosed arena environments, with a complex gameplay focused on tactical combat. Here we present a technique for segmenting matches into spatiotemporally defined components referred to as encounters, enabling performance analysis. In this paper, we apply encounter-based analysis to match data from the popular esport game DOTA, and present win probability predictions based on encounters. Finally, metrics for evaluating team performance during match runtime are proposed.
Win Prediction in Multi-Player Esports: Live Professional Match Prediction
 Esports are competitive videogames watched by audiences. Most esports generate detailed data for each match that are publicly available. Esports analytics research is focused on predicting match outcomes. Previous research has emphasised pre-match prediction and used data from amateur games, whichare more easily available than professional level. However, the commercial value of win prediction exists at the professional level. Furthermore, predicting real-time data is unexplored, as isits potential for informing audiences. Here we present the first comprehensive case study on live win prediction in a professional esport. We provide a literature review for win prediction in a multi-player online battle arena (MOBA) esport. The paperevaluates the first professional-level prediction models for liveDotA 2 matches, one of the most popular MOBA games and trials it at a major international esports tournament. Using standardmachine learning models, feature engineering and optimization,our model is 85% accurate after 5 minutes of gameplay. Our analyses highlight the need for algorithm evaluation and optimization and how professional data differs from amateur data.Finally, we present implications for the esports/game analytics domains, describe commercial opportunities, practical challenges,and propose a set of evaluation criteria for research on esports win prediction.
A Team Based Player Versus Player Recommender Systems Framework For Player Improvement

Modern Massively Multi-player Online Games (MMOGs) have grown to become extremely complex in terms of the usable resources in the games, resulting in an increase in the amount of data collected by tracking the in-game activities of players. This has opened the door for researchers to come up with novel methods to utilize this data to improve and personalize the user experience. In this paper, a novel but flexible framework towards building a team based recommender system for player-versus-player (PvP) content in such MMOGs is presented, and applied to a case study in the context of the major commercial title Destiny 2. The framework combines behavioral profiling via cluster analysis with recommendation systems to look at teams of players as a unit, as well as the individual players, to make recommendations to the players, with the purpose of providing information to them towards improving their performance.
Narrative Bytes: Data-Driven Content Production in Esports
 Esports – video games played competitively that are broadcast to large audiences – are a rapidly growing new form of mainstream entertainment. Esports borrow from traditional TV, but are a qualitatively different genre, due to the high flexibility of content capture and availability of detailed gameplay data. Indeed, in esports, there is access to both real-time and historical data about any action taken in the virtual world. This aspect motivates the research presented here, the question asked being: can the information buried deep in such data, unavailable to the human eye, be unlocked and used to improve the live broadcast compilations of the events? In this paper, we present a largescale case study of a production tool called Echo, which we developed in close collaboration with leading industry stakeholders. Echo uses live and historic match data to detect extraordinary player performances in the popular esport Dota 2, and dynamically translates interesting data points into audience-facing graphics. Echo was deployed at one of the largest yearly Dota 2 tournaments, which was watched by 25 million people. An analysis of 40 hours of video, over 46,000 live chat messages, and feedback of 98 audience members showed that Echo measurably affected the range and quality of storytelling, increased audience engagement, and invoked rich emotional response among viewers.


